

Why did the import intensity of GDP decline decline in 2023?
Prepared by Laura Lebastard, Laura Olivero and Giacomo Pongetti
Published as part of the ECB Economic Bulletin, Issue 3/2024.
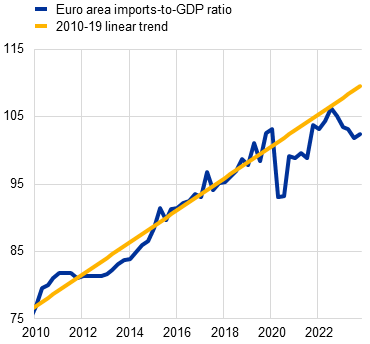
Euro area imports were subdued in 2023 despite supply bottlenecks easing significantly. During the pandemic, euro area trade declined more than economic activity as supply bottlenecks limited trade in goods and mobility restrictions curbed trade in services, particularly travel and tourism.[1] However, after rebounding in mid-2022, the euro area imports-to-GDP ratio fell in the first quarter of 2023 and has remained at a lower level since then, well below its long-term trend (Chart A, panel a). This can be attributed to the current weakness in imports, which is relatively homogenous across euro area countries, affecting large and smaller countries alike (Chart A, panel b). In this box, we investigate the drivers of the weakened import intensity of euro area GDP in 2023. We show that this weakness was mainly because of the composition of GDP growth following a period characterised by weak exports and consumption, which are among the most import-intensive components of GDP. In addition, we demonstrate that the reduction of inventories also played an important role in the decline in the import intensity of GDP.
Chart A
Ratio of imports to GDP for the euro area
a) Euro area aggregate |
b) Euro area countries |
|---|---|
(index: 2019 = 100) |
(quarter-on-quarter percentage changes) |
 |
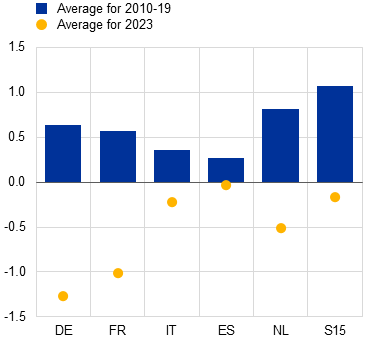 |
Source: Eurostat.
Notes: Panel a) refers to both intra and extra-euro area real imports of goods and services. Panel b) refers to total real imports of goods and services. S15 stands for the 15 smaller euro area countries. The ratio for the 15 smaller countries is a weighted average. The latest observations are for the fourth quarter of 2023.
The slowdown of import growth compared with economic activity in 2023 was not limited to the euro area, rather it was widespread across advanced economies. Most advanced economies experienced a similar downturn in their imports-to-GDP ratio in 2023 (Chart B). The weakness in global trade that year reflected a less trade-intensive composition of global economic activity alongside the unwinding of order backlogs and previous stockbuilding activities.[2]
Chart B
Ratio of imports to GDP for selected advanced economies
(index: 2019 = 100)
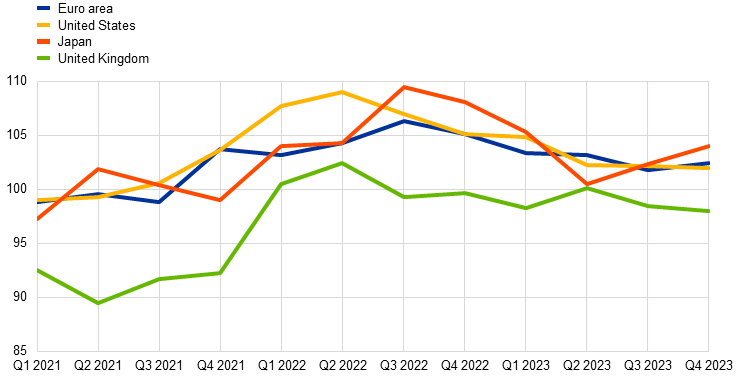
Sources: Eurostat and IMF World Economic Outlook database.
Notes: For the United States, Japan and the United Kingdom, this chart refers to total real imports of goods and services. For the euro area, it refers to both intra and extra-euro area real imports of goods and services. The latest observations are for the fourth quarter of 2023.
In the euro area, the composition of demand and the reduction of inventories can largely explain the fall in imports and, consequently, in the trade intensity of GDP in 2023. As in the case of other advanced economies, one of the driving factors behind the weakness in euro area imports was the shift in the composition of demand towards less trade-intensive components. Aggregate measures of economic activity, such as GDP, are not an ideal measure of import demand because they give a high weight to less trade-intensive components, such as government spending, which tend to be countercyclical in recessions or periods of weak growth. To take account of such composition effects, it is helpful to use import intensity-adjusted demand (IAD) as a measure of demand because higher weights are assigned to the most import-intensive components of GDP, such as exports and investment.[3] Using IAD and a lagged indicator of inventories in a simple regression framework shows that the disproportionate fall in trade-intensive components of final demand explains a large part of the moderation in imports in 2023 (Chart C). However, the swing in the inventory cycle was also an important contributing factor, as firms ran down stocks and thereby reduced import demand.[4]
Chart C
Decomposition of euro area import developments
(year-on-year percentage changes)
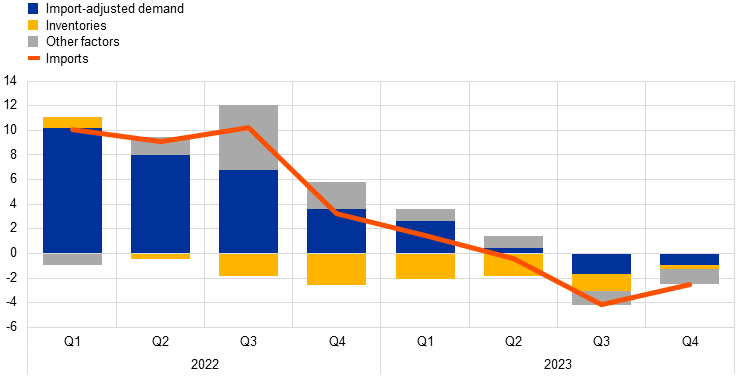
Sources: Eurostat and Asian Development Bank.
Notes: Import intensity weights for IAD are computed following Bussière et al. (2013). Annual weights are computed for the period 2007-22 and then averaged. The regression is run on quarterly data from the first quarter of 1996 to the third quarter of 2023. Inventories are measured using European Commission survey data.
The rotation of domestic demand from goods to services also contributed to the weakness in euro area imports. The other factors shown in Chart C could be related to the shift in consumption from goods to services, which meant that household spending became less import-intensive over the course of 2023 (Chart D). Indeed, the share of imports in goods consumption was 51% in 2022, compared with 13% for services consumption.[5] The faster growth in the services sector than in the manufacturing sector in 2023 reflects the difference in the effects of the post-pandemic reopening, the monetary policy tightening and the rise in energy prices.[6] Real imports of gas and oil in the euro area decreased in 2023 by 7% and 5% respectively compared with 2022, reflecting lower energy consumption caused by the extraordinary surge in energy commodity prices.
Looking ahead, the euro area imports-to-GDP ratio is expected to recover. Over the medium term, the recovery of more import-intensive components, as highlighted in the March 2024 ECB staff macroeconomic projections for the euro area, is expected to bring the trade intensity of euro area GDP back to its long-term trend.[7] In the short term, forward-looking indicators of consumption point to a more robust pick-up in households’ consumption of goods in 2024 compared with services. Together with the slowing drawdown of inventories, this should lead to a higher import intensity of demand components.

EIN Presswire does not exercise editorial control over third-party content provided, uploaded, published, or distributed by users of EIN Presswire. We are a distributor, not a publisher, of 3rd party content. Such content may contain the views, opinions, statements, offers, and other material of the respective users, suppliers, participants, or authors.